If you aren’t on the front lines of infrastructure monitoring and automation, it might be difficult to appreciate what great monitoring and automation tools can do to innovate for your organization. But even when equipped with the best tools, big organizations move slowly and require a lot of stakeholder input prior to taking action.. so even the biggest wins can happen in slow motion…which isn’t very satisfying. We like big dramatic wins in short periods of time. So let’s talk about a recent big win I had in my personal household which can serve as an illustration for how greater visibility and monitoring can lead to dramatic changes.
I’ve long had high energy bills. My Winter/Summer bills have slowly been increasing over the years from $300/month… to $600 month. A few months ago I decided to do some research and figure out what tools existed on the market to provide visibility into what was causing the escalation. I hadn’t joined the smart revolution (Internet Of Things) yet so I was starting from scratch. I had dabbled here and there, but I was now ready to go into the deep end of the pool.
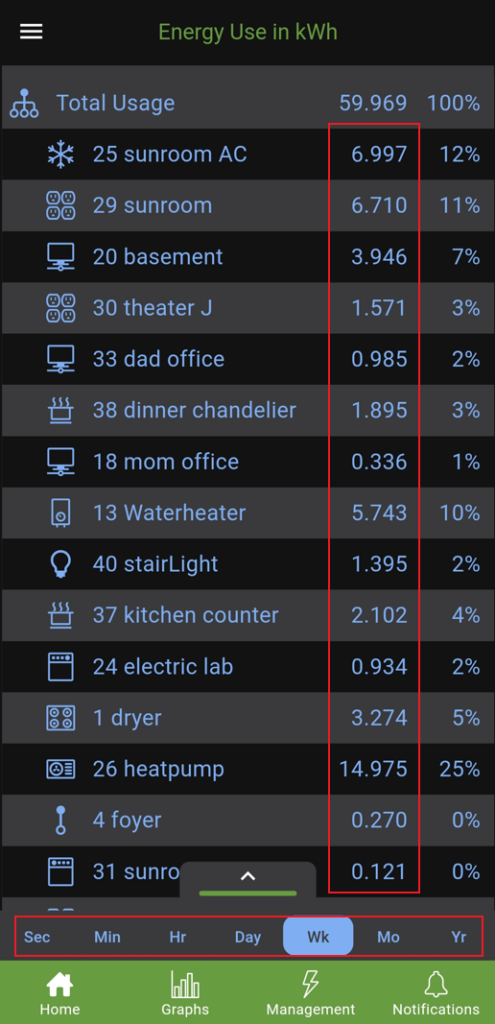
The first tool I invested in was a pack of CT sensors to monitor at my home panel the amp/kw draw on each circuit in my home. I now had usage analytics by the second, minute, hour, day, week, month, and year. I could see my heatpump spending my paycheck in real time. I knew it was a resource hog all along, of course, but when you see the energy usage real time and know you have the power to limit that usage with a tweak of the thermostat…the solution can no longer be ignored. But finding the point of dimishing returns on energy usage takes time to dial in… and more monitoring tools…and automation.
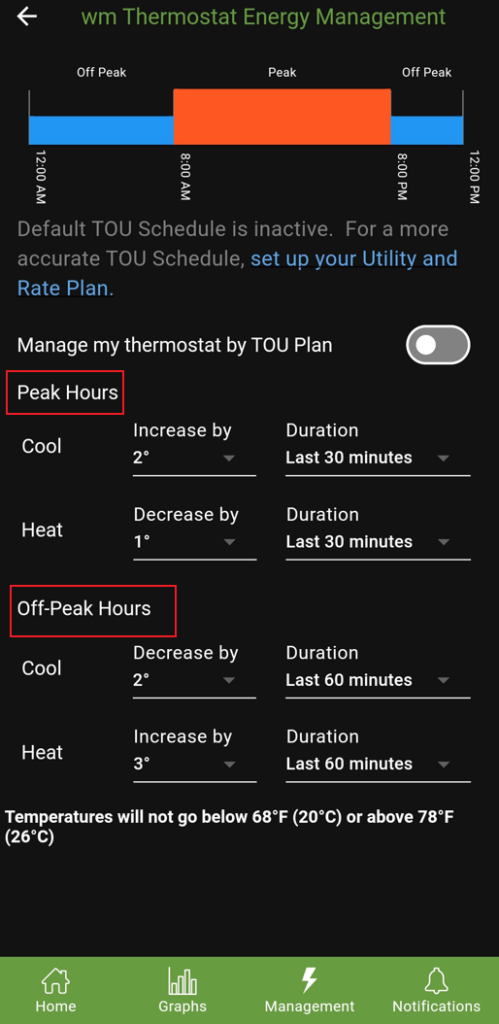
So I started by limiting heating to certain times when people needed it, not when they were tucked in bed under comforters. And I noticed that my heat pump was actually supplied by 2 different double pole breakers. Apparently, it’s two heatstrips were on different circuits. So I turned off one of those to see the difference in energy usage and it was enormous. The 2nd auxillary heat strip wasn’t afraid to use $1.20 per hour of energy and it kicked in far too frequently. With the 2nd heat strip turned off, my home would heat up slower, but the difference on the energy bill would be worth it.
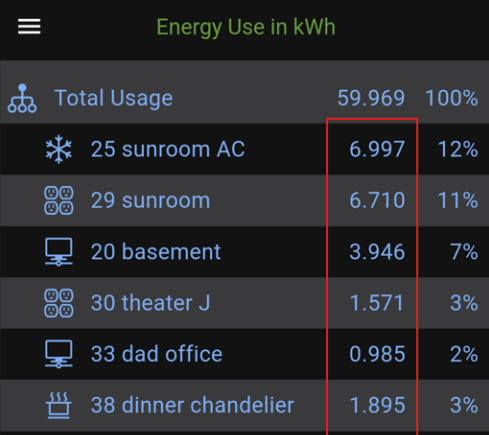
My dinner table chandelier, which I keep on for ambient light turned out to be an energy guzzler so it got dimmed (instead of full brightness), the hot tub got turned down from 96 to 92 holding temperature, my 12 computers (don’t ask why I have so many) would now go into sleep mode after 15 minutes, my server rack got powered down when not in use, the sunroom thermostat went down….and now you might be thinking…”your quality of life was going down too!”….but that is where the big insights are to be found. Yes, my quality of life was changing…for the better.
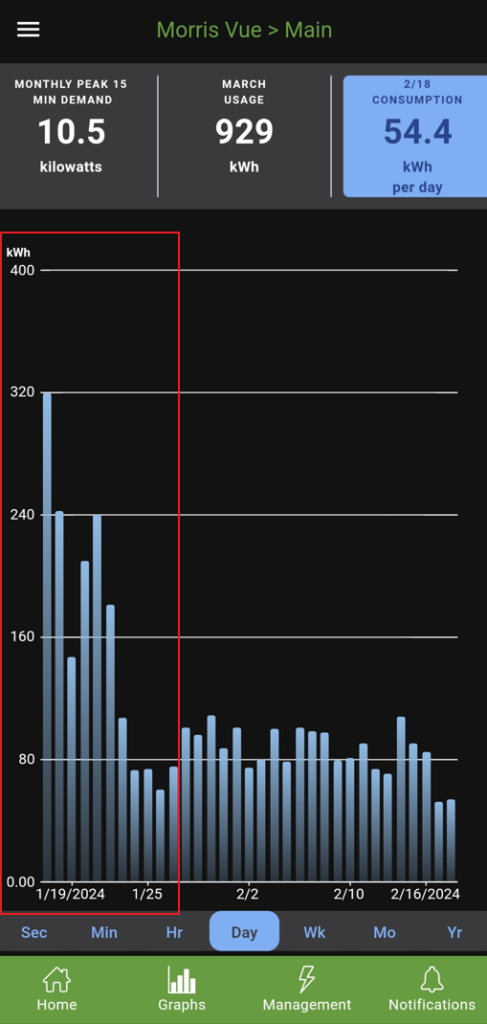
First, I love to save money and I was starting to realize this energy reduction exercise would net me well over $1000/yr or $10,000 over a short ten year period. But, keeping the house cooler got me moving more, cleaning more inside and outside. I painted the house. A cooler home motivates you to work up a sweat. My kids played outside more for the same reasons. I went from 320 kwh/day to 100 kwh/day. So I implemented more monitoring and automation tools.
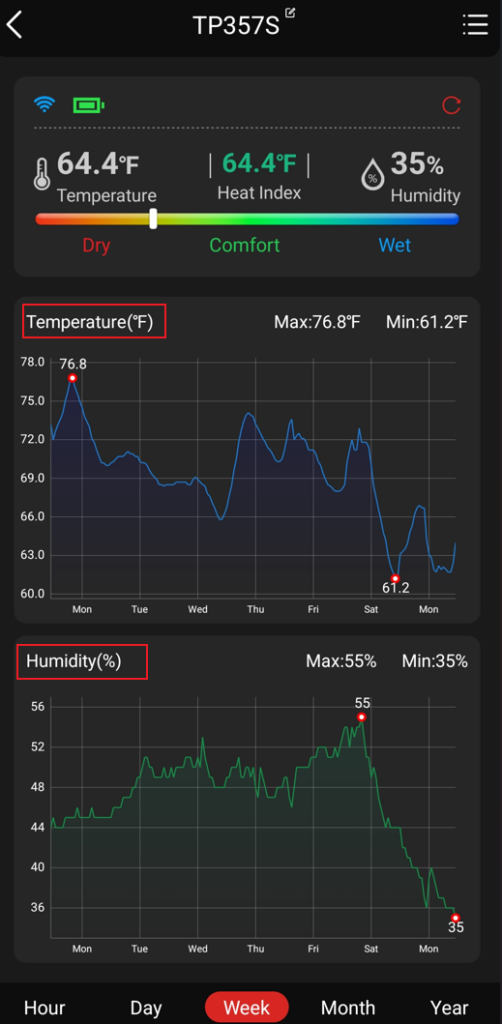
I started logging temperature and humidity in the house, and created automation to respond to certain signals. My thermostat controls got imported into my energy monitoring app so I could automate further. But my home wasn’t just becoming smart…I was too. Maybe it was time to start building my own power plant: a solar system. Turns out if you diy, you can get the price of a kwh down to $.03 for the next 20 years taking advatange of the 30% federal tax credit to offset your initial investment into solar panels, inverters, and batteries. That’s better than $.09/kwh from the electric company. But, I’m getting away from my point…so let’s recap.
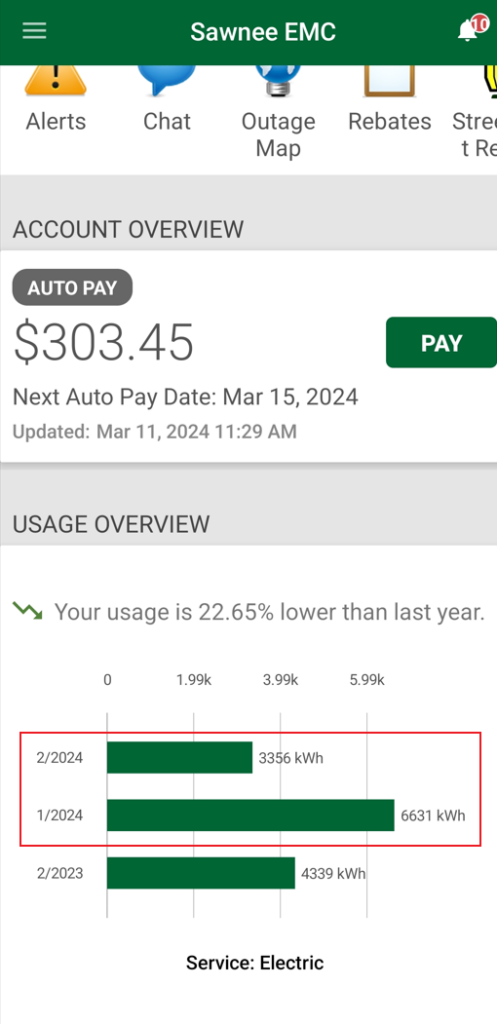
February 2024 and Jan 2024 were similarly cold, and yet the energy usage is dramatically less in February 3356 kwh vs Jan 6631 kwh. I installed my monitoring equipment Jan 16 and took immediate action so January was likely to be around 8000 kwh. We can also see that last Februrary 2023 (which was much warmer than February 2024) still had 4339 kwh usage vs 3356 kwh this year. The visibility created by the monitoring systems created a snowball effect quickly leading me to reduce energy consumption, find and turn off inneficient auxillary heat strips, become more active/mindful, and figure out how to build my own solar system..all of which will save me thousands every year for the next several decades.
$200 of energy monitoring tools led to $50,000 of savings (or maybe $25,000 if we account for time value of money…if we want to be technical). And the same results can happen downstream from implementing infrastructure monitoring and automation tools. 2nd order effects are hard to predict and sometimes hard to account for, but we know intuitively that they are powerful.
Here’s the BIG idea:
Monitoring tools lead to identifying problems…
and those problems continually manifest on dashboards…
which creates motivation to solve them…
which creates more intimate understanding of your whole system…
which creates more attention and better processes…
which can then be automated…
freeing up more time to be proactice in solving more problems…
and creating more value.
+ There are no comments
Add yours