So you’ve created your Custom Group Types & Custom Groups…now you can monitor them on your Custom Dashboard.
Note: This is a continuation from this post here which explains how to create Custom Group Types and Custom Groups.
2nd Note: We won’t cover all the steps of building custom dashboards, just the necessary ones in regards to leveraging Custom Groups.
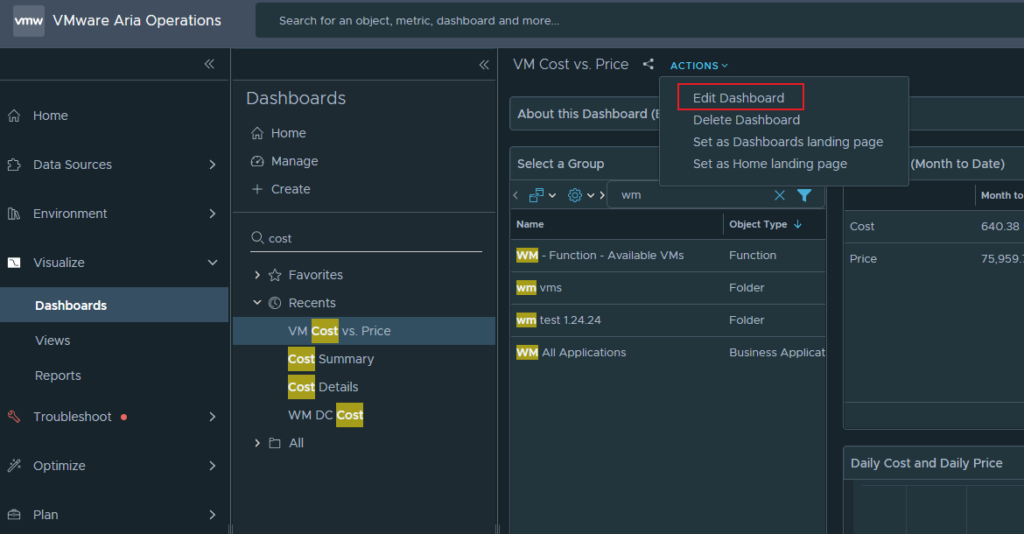
First, you’ll need to click Edit Dashboard.
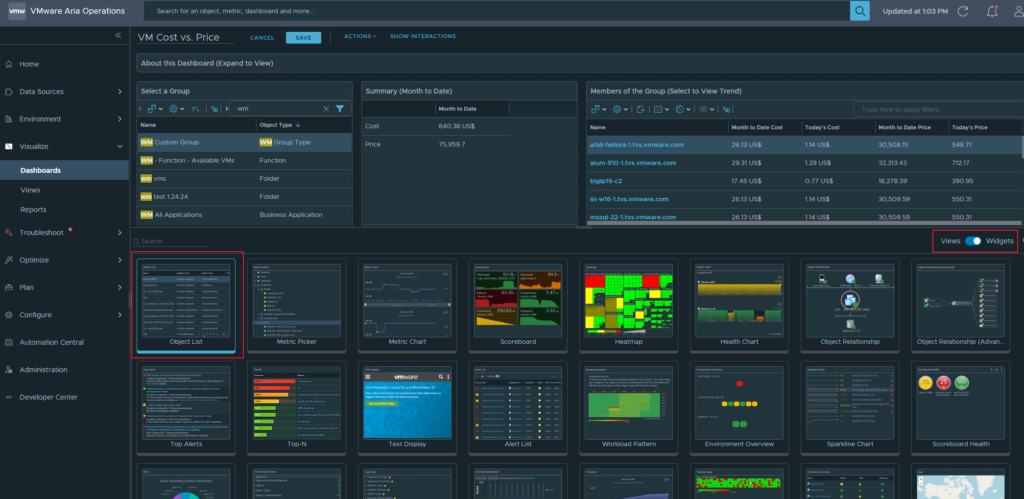
At the bottom, a new menu has opened and you’ll want to select an Object List widget, drag it onto your dashboard, and then edit the widget.
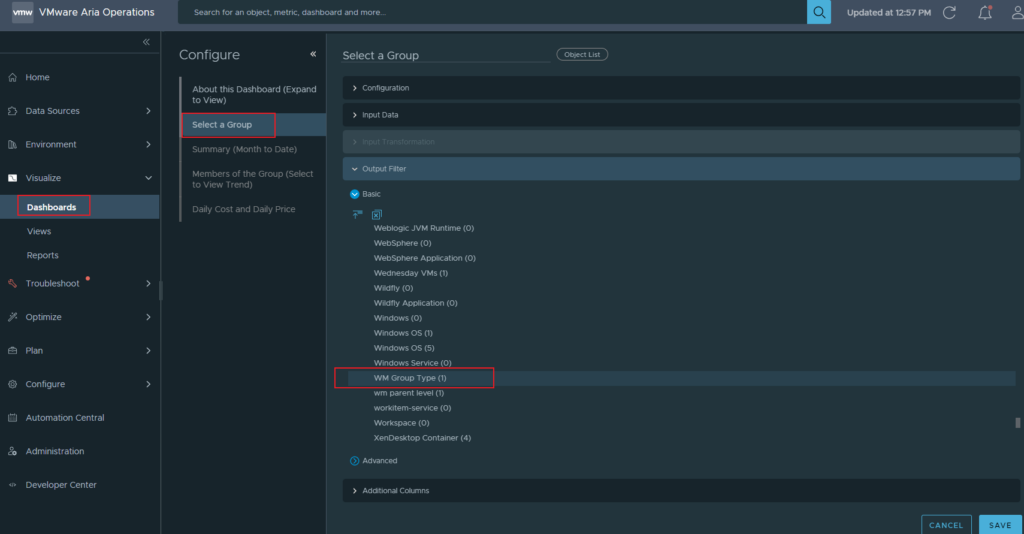
When editing your object list widget, under Output Filter, make sure to select your new Group Type (which you’ll find under Object Types in the list). Save and close the editing wizard.
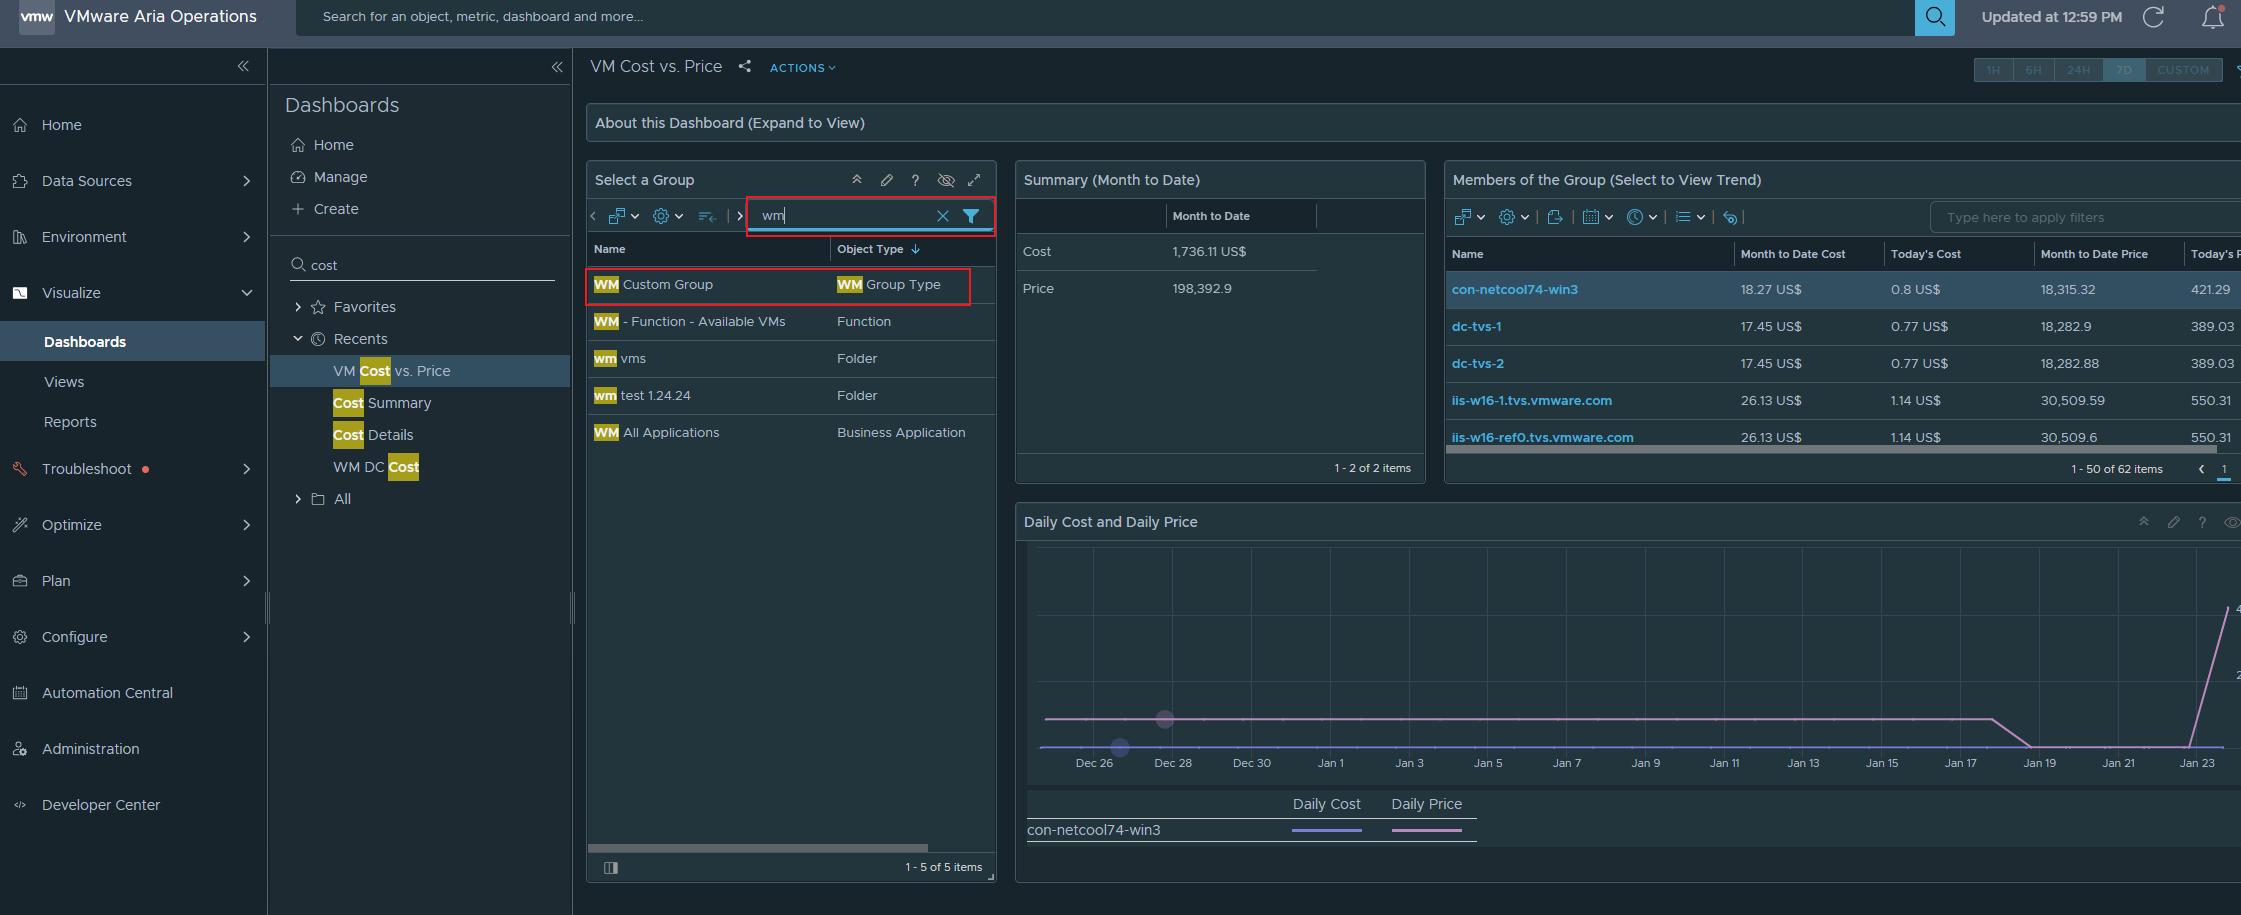
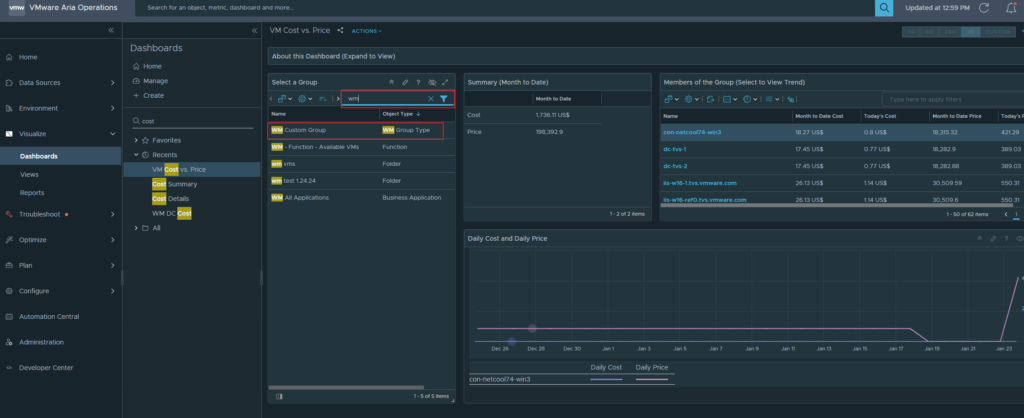
Back on your dashboard, you can now filter for a keyword to find your Custom Group. I’ve filtered for WM and found my WM Custom Group which is a WM Group Type.
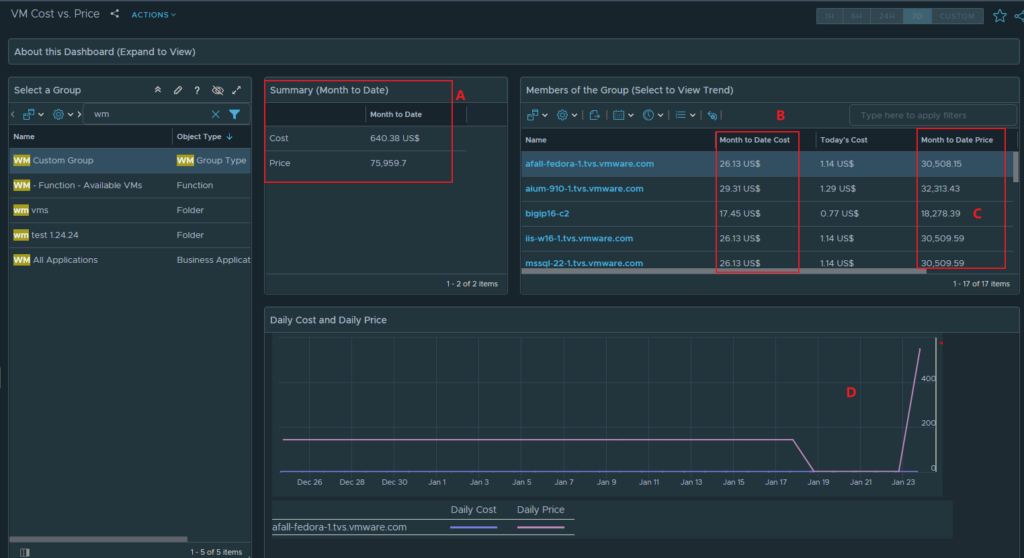
Now, we can monitor the 17 virtual machines that belong to my WM Custom Group. In this example below, I’m looking at Cost (expense) vs Price (revenue) of this group of VMs. A is the total of the group’s cost and price, B is the month-to-date cost of each vm, C is the month-to-date price of each vm, and D is displaying Cost/Price across time of the whole group.
You can measure any metric or property of any object inside Aria Operations using this workflow. It starts with creating Custom Groups and then building Custom Dashboards that point at the Custom Groups.
+ There are no comments
Add yours